Market valuations: The importance of selecting the ‘risk-free' rate
Market valuations: The importance of selecting the ‘risk-free' rate
Selecting the risk-free rate based on the duration of cash flows has become increasingly relevant in light of the AASB 16 Leases (‘AASB 16’) standard.
In valuation theory, when determining the risk-free rate, the valuer should match the risk-free security with the expected period in which cash flows are to be valued.
It is common market practice to use a 10-year or 20-year government bond yield in the discount rate build-up when valuing a going concern business with a perpetual life. When valuing contracts (or ‘right-to-use’ assets/obligations as in the case of AASB 16), cash flows are expected over a discrete period (e.g. ten years) and it is common to see the practitioner matching the contract length with a risk-free security of a similar length (e.g. a ten-year government bond yield when valuing a ten-year contract).
This article has been created for valuation practitioners and auditors to illustrate examples where the application of 10-year or 20-year risk-free yields is the correct assumption. The article also explores how the application of a ten-year yield when valuing a ten-year contract is almost always incorrect. This is of increased importance given the introduction of the lease standards (AASB 16), which ask valuation practitioners to provide (or review) the incremental borrowing rate (IBR) for a lessee.
The concept of duration
The concept of duration is closely connected with matching risk-free security with the period in which cash flows to be valued are expected. Duration has its roots in risk management and is a measure of the interest-risk sensitivity of assets and liabilities. It is the weighted average of years until the underlying cash flows are received and helps tell investors two key things:
- How long it will take - on average - to get their original investment back
- How sensitive an asset (e.g. a bond) is to changes in interest rates.
Theoretically, the longer an asset’s duration, the more sensitive it is to changes in interest rates. To manage interest rate risk, strategies of duration-matching and immunisation are commonly applied and involve matching the duration of the liability with the duration of the asset.
Similarly, duration-matching is important when discounting a set of cash flows to present value (PV). In theory, it is correct to discount each year’s expected net cash flow estimate using a matched maturity risk-free rate. That is, cash flow in year one is discounted by a one-year government bond rate + asset risk (in CAPM represented as the beta factor times the equity market risk premium), cash flow in year two is discounted by a two-year government bond rate + asset risk, and so on.
As a practical compromise when valuing long-term investments and going concern businesses, valuers generally use a simplifying assumption of long-term government bonds as the risk-free security when discounting all years’ cash flows. The time to maturity of the long-term government bond serves as a proxy of the weighted duration of the cash flows of the asset being valued, with some cash flows expected prior to the term of the government bond, while other cash flows are expected thereafter.
Illustrative example: Duration of cash flows for a going concern business
When valuing a going concern business, it is sometimes argued that the valuer should match the cash flows with a discount rate based on a risk-free security with the longest available maturity (30 years or longer). In the below example, based on the discounted cash flow (DCF) methodology, we have shown that the duration of cash flows for a going concern business is much shorter in most instances.
In this example, the DCF generates a value of $100 when assuming equity cash flows of $10, perpetual equity cash flow growth of 2 per cent, and cost of equity (CoE) of 12 per cent (see Table 1 below).
The Macaulay duration formula (which weights the cash flows based on market value/present value) has been used. As shown in Table 1 below, the duration is 11.2 years, based on the above cash flows ($10 growing at 2 per cent into perpetuity), a CoE of 12 per cent, and end-year discounting, assuming all the equity cash flows are distributed as dividends at the end of each year.
Table 1 – Illustrative example of cash flow duration
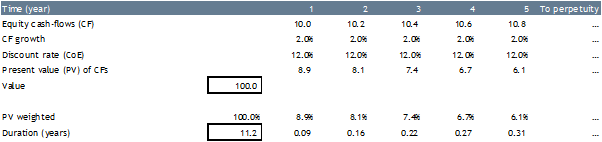
Apart from the timing of cash flows, duration is a function of the equity discount rate and growth in equity cash flows. Duration in any given year is calculated as the present value of the cash flows in that year, divided by the total present value of the cash flows, multiplied by the number of years from the valuation date. For example, the duration in year 3 is PV of 7.4 divided by total value of 100 x year 3 = 0.22.
As duration is the result of an infinite combination of discount rates and growth rates, Table 2 illustrates the sensitivity of cash flow duration when altering these. We have also cross-checked our results against the workings published by Shannon Pratt, a well-known authority in the valuation community, and note they are consistent (see Cost of Capital: Applications and Examples).
Table 2 – Duration sensitivity (years)
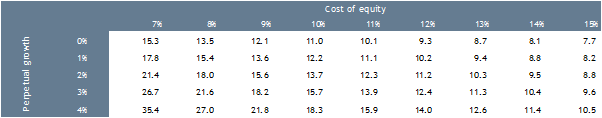
Table 2 highlights some interesting takeaways. It shows us that applying a risk-free security with a maturity of 30 years would only be appropriate when valuing going concern businesses with relatively low risk (CoE of 7-8 per cent) and high perpetual growth (3 to 4 per cent). Instead, it suggests shorter duration for the stock market (large cap). Today’s expected equity market returns in developed financial markets of approximately 8 to 10 per cent, in conjunction with modest expectations of perpetual growth (1.5 to 3.0 per cent), suggest durations from low teens to approximately 20 years. Furthermore, when valuing smaller businesses (relative to large cap companies) durations of approximately ten years do not appear unreasonable given their higher cost of equity (small cap premiums, etc.).
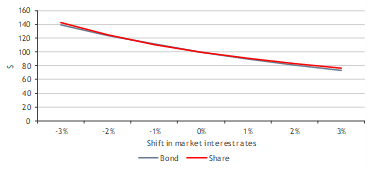
Having established that the duration of equity cash flows growing at two per cent into perpetuity is 11.2 years (assuming CoE of 12 per cent), we can put the results to the test by using an immunisation strategy. Let’s assume that an investor invests $100 in a company with equity cash flows of $10, perpetual equity cash flow growth of two per cent, and cost of equity (CoE) of 12 per cent. The investor is financing the investment by selling $100 worth of a risk-free security (short selling). At the same time, the investor wants to make sure the interest rate risk is limited and decides that selling $100 worth of a two per cent yield, zero-coupon bond maturing in 11 years will do the trick (consistent with duration matching).
Figure 1 shows the development in value of each instrument (bond and shares) given shifts in market interest rates following the investment. This assumes a parallel shift in the market yield curve and all other assumptions (e.g. equity cash flows and growth) remain the same. With duration matching and immunisation, the movement in values should be equal. Duration matching and immunisation only works perfectly when rates move in small increments. Duration is a linear measure of how the price of an asset changes in response to interest rate changes. As interest rates change, the price does not change linearly but rather is a convex function of interest rates. As can be seen in Figure 1, a downward parallel shift in market interest rates (yield curve) of one per cent increases the value of the bond and shares from $100 to $111. An upward shift of one per cent decreases the value of the bond and shares to $90 and $91, respectively.
Figure 1 – Development in values following shifts in interest rates – Shares vs bond (11-year term)
Let’s also assume the investor believes that because the equity cash flows are to be received into perpetuity, a better strategy is to match the equity investment with a longer maturity bond, and therefore decides to proceed with a 30-year government bond. As previously mentioned, when comparing two instruments, the one with the longest duration will be more sensitive to changes in interest rates – as shown in Figure 2.
Figure 2 – Development in values following shifts in interest rates – Shares vs bonds (30-year term)
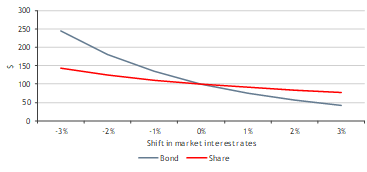
To summarise, matching the equity cash flow duration with a longer-term bond (a 30-year government bond) would not be consistent in this case. In fact, data presented in the illustrative example above suggests durations of low teens to approximately 20 years, and closer to 10 years for smaller companies.
Illustrative examples – Duration of cash flows for a lease
Let’s turn our attention to the cash flow duration of contracts with finite lives (e.g. leases). The below illustrative example applies the same concept of duration as previous, and again shows this assumption to be theoretically incorrect.
In this example, let’s assume that a company (lessee) has entered a lease contract which gives them the right to use the underlying asset for the next ten years. In return, the lessee is paying annual rent (at the end of each year) of $10, inflated by 3.5 per cent per year (nominal contract value of $117.3). To discount the lease payment to present value, the valuer has to determine the lessee’s incremental borrowing rate (IBR). The IBR is defined in IFRS 16 Leases as ‘The rate of interest that a lessee would have to pay to borrow over a similar term, and with a similar security, the funds necessary to obtain an asset of a similar value to the right-of-use asset in a similar economic environment. In this example (see Table 3), we have assumed the IBR is made up of Australian government bond yields as of 21 August 2023 plus an additional and constant asset-specific risk premium of two per cent.
Table 3 – IBR assumptions

If the valuation of the lease contract is based on a discount rate of 6.31 per cent (AUS IBR ten-year tenure), the calculated value is $83.6 (see Table 4). However, the value is $84.3 if applying matching discount rates to each year’s lease payments (see Table 5). The only time results from Tables 4 and 5 will match is when the yield curve is flat. Usually, both the risk-free rate and financing spread increase with the term of the instrument. It should be mentioned that the yield curve in August 2023 reflected fears of a slowdown in the economy (with inflation decreasing) and the difference in value would have been higher with the steeper yield curves of the past.
Table 4 – Value of lease assuming a 10-year discount rate (IBR)

Table 5 - Value of lease assuming maturity matching

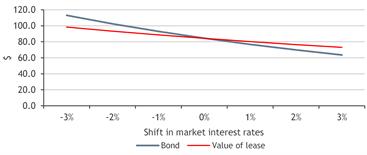
Again, let’s put the results to the test by using an immunisation strategy and the same methodology as in the first illustrative example. As the cash flow duration of the above ten-year lease is approximately five years, the alternative investment is based on a five-year risk-free security. As can be seen in Figure 3, the interest rate risk is almost eliminated with this approach. However, the assumption of a ten-year IBR when discounting the lease payments does not result in immunisation (see Figure 4).
Figure 3 – Development in values following shifts in interest rates – Lease value vs bond (five-year term)
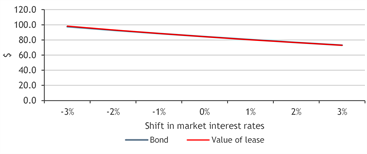
Figure 4 – Development in values following shifts in interest rates – Lease value vs bond (ten-year term)
The theoretically correct approach - to discount each lease payment with a matching discount rate - is cumbersome, especially if the lease contract stipulates monthly payments as opposed to yearly (monthly payments over ten years would require 120 individual discount rates). A simplifying assumption would be to use one weighted discount rate for all lease payments (and for bundles of leases with similar characteristics). This weighted discount rate would ideally be one that generates the same value as with the detailed approach (similar to the internal rate of return concept). To summarise, in most instances, a value-weighted rate (or even time-weighted) is a good enough proxy and is certainly more correct than applying rates based on the total term of the lease, and more so the steeper the yield curve.
Conclusion
According to the illustrative examples presented in this article, the application of 10-year or 20-year risk-free yields when valuing a going concern business is often a correct assumption. However, the application of a ten-year yield when valuing a contract with regular payments over ten years is almost always incorrect – the exception being if the underlying yield curve is flat.
BDO’s Valuations team provide guidance through all stages of valuation and capital market analysis, helping companies across industries identify and evaluate opportunities and execute strategies. Contact a member of the team to discuss your needs.